Welcome to tellmon.net's feedback and support center. Please post feedback, suggestions and bug reports here.
No similar topics found.

0
Completed
 Update text in: How to setup wireless energy meter from FooGadgets
The How to for the Wireless Energy meter need to be updated.
It is mixing blinks and impulses and refer to impressions.
I have also tried to clarify impulses per Wh.
Here is the proposed update,
"The Wireless Energy meter from FooGadgets is detected by Tellstick as two temp/humidity sensors. One is the primary sensor and the other is a backup sensor.
Tellmon uses only the primary sensor.
Go to http://tellmon.net/profile/SensorSettings.aspx and find the energy sensor. Check the "energy meter" checkbox and enter the number of impulses per Wh (Watt-hour).
You energy meter will most likely be labeled with the imp/kWh value like this:
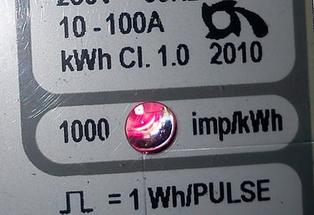
This stands for impulses per kWh. This means that the LED will blink 1,000 times for each kWh. 1 kWh = 1,000 Wh. In other words it will light up once for every Wh. So the value to insert in Tellmon's sensor options is 1.
For 10,000 imp/kWh the value to insert is 10.
Click Save and enjoy!"
Thanks for an exellent service Pål!
It is mixing blinks and impulses and refer to impressions.
I have also tried to clarify impulses per Wh.
Here is the proposed update,
"The Wireless Energy meter from FooGadgets is detected by Tellstick as two temp/humidity sensors. One is the primary sensor and the other is a backup sensor.
Tellmon uses only the primary sensor.
Go to http://tellmon.net/profile/SensorSettings.aspx and find the energy sensor. Check the "energy meter" checkbox and enter the number of impulses per Wh (Watt-hour).
You energy meter will most likely be labeled with the imp/kWh value like this:
This stands for impulses per kWh. This means that the LED will blink 1,000 times for each kWh. 1 kWh = 1,000 Wh. In other words it will light up once for every Wh. So the value to insert in Tellmon's sensor options is 1.
For 10,000 imp/kWh the value to insert is 10.
Click Save and enjoy!"
Thanks for an exellent service Pål!

0
Fixed
 Error 400: Bad request
Trying to graph a temperature and humidity reading from a spesific sensor, other than default sensor selection 1. & 2. when the app prompts error msg described in the topic. Logged out, tried to graph at different daytimes, still the same result. Worked fine for 2 weeks

0
Two (or more?) scales for the graph
Can we have two scales for the Y-axis in graph, to make for better graphs where data with different units and ranges are used. For ex. humidity and temperature.


0
Fixed
Day, week and month buttons don't work
Hi
Since new page for sensors come the buttons for Day, Week and Month don't work.
Even the selection of sensors scrollbox seems not fully work as I need if I want to see all tick in all twice.
I have now tested the new page only from iphone and will test later from my pc.
Per
Since new page for sensors come the buttons for Day, Week and Month don't work.
Even the selection of sensors scrollbox seems not fully work as I need if I want to see all tick in all twice.
I have now tested the new page only from iphone and will test later from my pc.
Per

Answer
Pål Andreassen (CTO)
12 years ago
The bug is fixed and the range buttons as well as the channel selection now works as it should.
Make sure to refresh your browser to get the latest script files.
Make sure to refresh your browser to get the latest script files.


0
Fixed
Delete account doesn't delete it.
I've tried to delete my account without success.
When I click delete account on the "Profile-page" it pops-up a confirm-box in which I answer yes, after that I get back to the "Profile-page" and I'm still logged in and my sensor-values are still stored?
I've tried this procedure at least 10 times with same result.
/BR, Pär
When I click delete account on the "Profile-page" it pops-up a confirm-box in which I answer yes, after that I get back to the "Profile-page" and I'm still logged in and my sensor-values are still stored?
I've tried this procedure at least 10 times with same result.
/BR, Pär

0
Not a bug
My data are gone. No graph shows up???
None of my sensors are showing up, that is no graphs. I can see the momentary data but no history. This happened last week and still the same problem.
0
Under review
Increase date field
I think we need to increace date fields so we se all dates like 06.06.2014 01:15 and not as we see now 06.06.201

0
Under review
Hide Devices?
Hi! Awsome site! I have one thing i miss, and that is to hide som devices becouse i have some "dummy" devices for some functions and it would be nice to hide them in the device list,
Customer support service by UserEcho