Welcome to tellmon.net's feedback and support center. Please post feedback, suggestions and bug reports here.
No similar topics found.

+5
Completed
 Several sensor graphs in one diagram
I would like to be able to group related sensors in one diagram for analysis. For example to compare humidity outdoors, in my basement and attic. To compare outdoors temperature, indoors temperature and heating system and so on.


Answer
Pål Andreassen (CTO)
11 years ago
Can you try again now? I have modified the formula to show kWh.
+1
Completed
Add support for user selectable timezone
Add support for the user to select which timezone to use when displaying data.

+1
Completed
Logging of doorbell
Would be nice to be able to log everytime somone is pushing the doorbell (Nexa Wireless doorbell). This way it is possible to monitor activity when I am vacation.
+1
Completed
Support for blinds and other up/down type devices
Add support for blinds and other up/down type devices

0
Fixed
 Wireless Energy meter: Is high count values handled correct?
Hi Pål!
I just realized that I might have forgot to give you one piece of information regarding the counter value.
The data-field that I use in the fineoffset protocol to carry the amount of detected blinks have 12 bits. The msb is used on the receiving side to indicate if the temperature is positive or negative. Since I use all bits for only positive numbers, this will give a fault if the blink count is more than 2047 i.e. 204.7C
This is however very easy to fix.
if ( temp < 0.1 ) { temp = 204.7 - (temp); }
The reason for the (temp<0.1)-test is that if the counter counts 2048 pulses this will show up on the receiving side as -0.0C. The test (temp<0) is thus not correct. It is perfectly safe to use this test since the Energy meter will never send 0.0C.

0
Answered
 Label in graph
Is it possible to move labels out of graph area as they hide the graph data at least when I use my iphone?
Answer
Pål Andreassen (CTO)
11 years ago
The next release will have a modified sensor page with the legend moved to the statistics table below the graph like this:

0
Completed
Update text in: How to setup wireless energy meter from FooGadgets
The How to for the Wireless Energy meter need to be updated.
It is mixing blinks and impulses and refer to impressions.
I have also tried to clarify impulses per Wh.
Here is the proposed update,
"The Wireless Energy meter from FooGadgets is detected by Tellstick as two temp/humidity sensors. One is the primary sensor and the other is a backup sensor.
Tellmon uses only the primary sensor.
Go to http://tellmon.net/profile/SensorSettings.aspx and find the energy sensor. Check the "energy meter" checkbox and enter the number of impulses per Wh (Watt-hour).
You energy meter will most likely be labeled with the imp/kWh value like this:
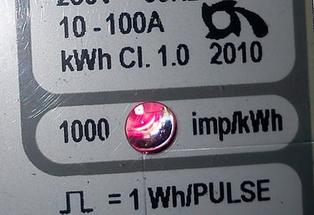
This stands for impulses per kWh. This means that the LED will blink 1,000 times for each kWh. 1 kWh = 1,000 Wh. In other words it will light up once for every Wh. So the value to insert in Tellmon's sensor options is 1.
For 10,000 imp/kWh the value to insert is 10.
Click Save and enjoy!"
Thanks for an exellent service Pål!
It is mixing blinks and impulses and refer to impressions.
I have also tried to clarify impulses per Wh.
Here is the proposed update,
"The Wireless Energy meter from FooGadgets is detected by Tellstick as two temp/humidity sensors. One is the primary sensor and the other is a backup sensor.
Tellmon uses only the primary sensor.
Go to http://tellmon.net/profile/SensorSettings.aspx and find the energy sensor. Check the "energy meter" checkbox and enter the number of impulses per Wh (Watt-hour).
You energy meter will most likely be labeled with the imp/kWh value like this:
This stands for impulses per kWh. This means that the LED will blink 1,000 times for each kWh. 1 kWh = 1,000 Wh. In other words it will light up once for every Wh. So the value to insert in Tellmon's sensor options is 1.
For 10,000 imp/kWh the value to insert is 10.
Click Save and enjoy!"
Thanks for an exellent service Pål!

0
Fixed
Error 400: Bad request
Trying to graph a temperature and humidity reading from a spesific sensor, other than default sensor selection 1. & 2. when the app prompts error msg described in the topic. Logged out, tried to graph at different daytimes, still the same result. Worked fine for 2 weeks
0
Fixed
Day, week and month buttons don't work
Hi
Since new page for sensors come the buttons for Day, Week and Month don't work.
Even the selection of sensors scrollbox seems not fully work as I need if I want to see all tick in all twice.
I have now tested the new page only from iphone and will test later from my pc.
Per
Since new page for sensors come the buttons for Day, Week and Month don't work.
Even the selection of sensors scrollbox seems not fully work as I need if I want to see all tick in all twice.
I have now tested the new page only from iphone and will test later from my pc.
Per
Answer
Pål Andreassen (CTO)
11 years ago
The bug is fixed and the range buttons as well as the channel selection now works as it should.
Make sure to refresh your browser to get the latest script files.
Make sure to refresh your browser to get the latest script files.
Customer support service by UserEcho