- Suggestions and feedback
-
 Questions

0
Answered
Energy meter display graph
I don't get it... I don't know exactly how to set up the display graph for Energy Meter. In Telldus Live is not clear which is the "primary" sensor ("Tellmon uses only the primary sensor"). I assumed is the one with a lower ID.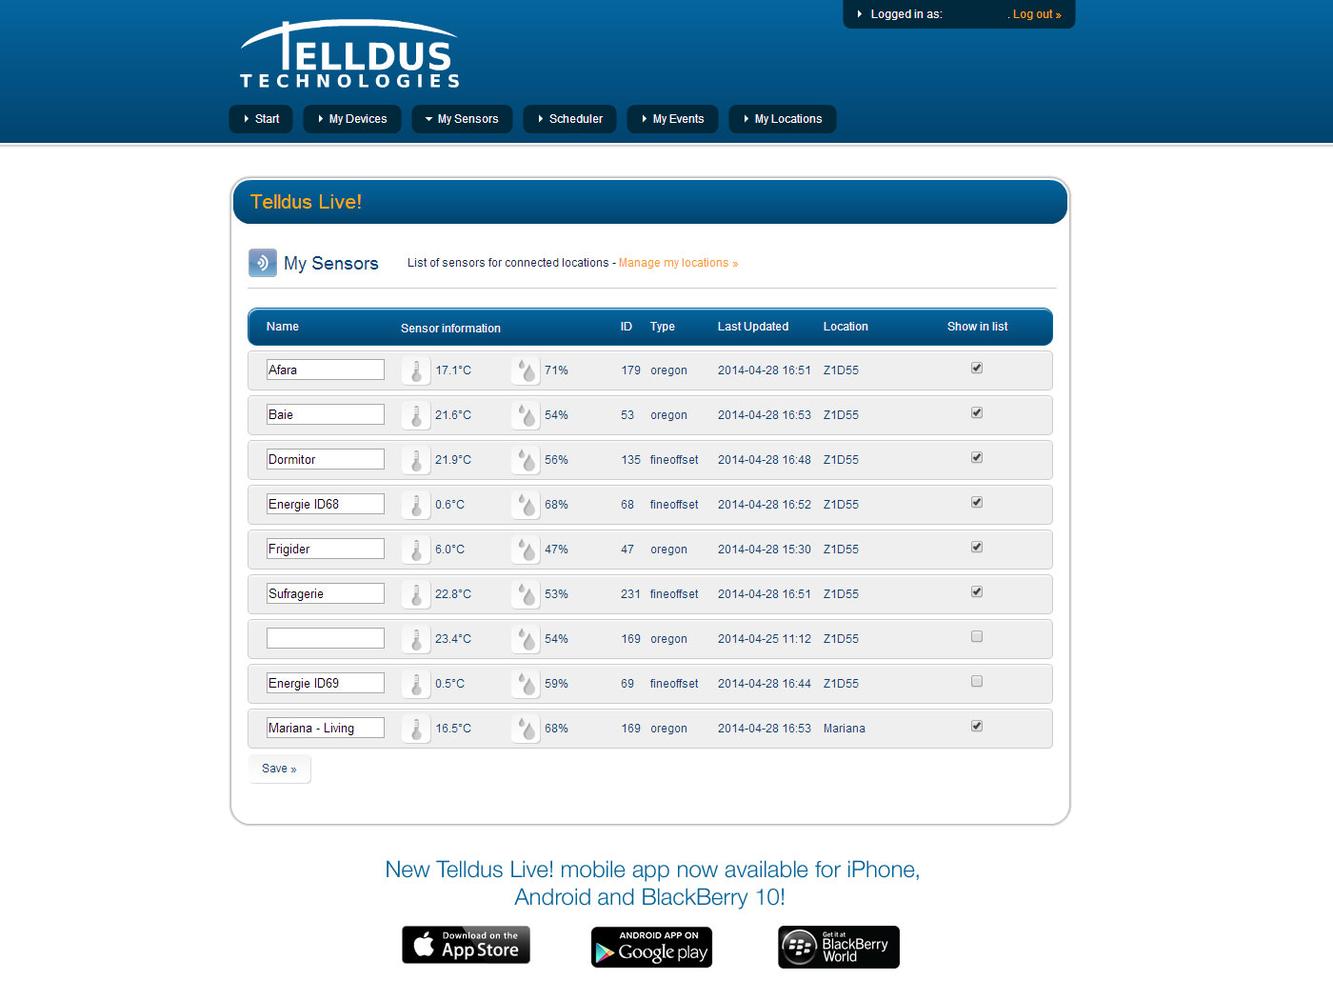
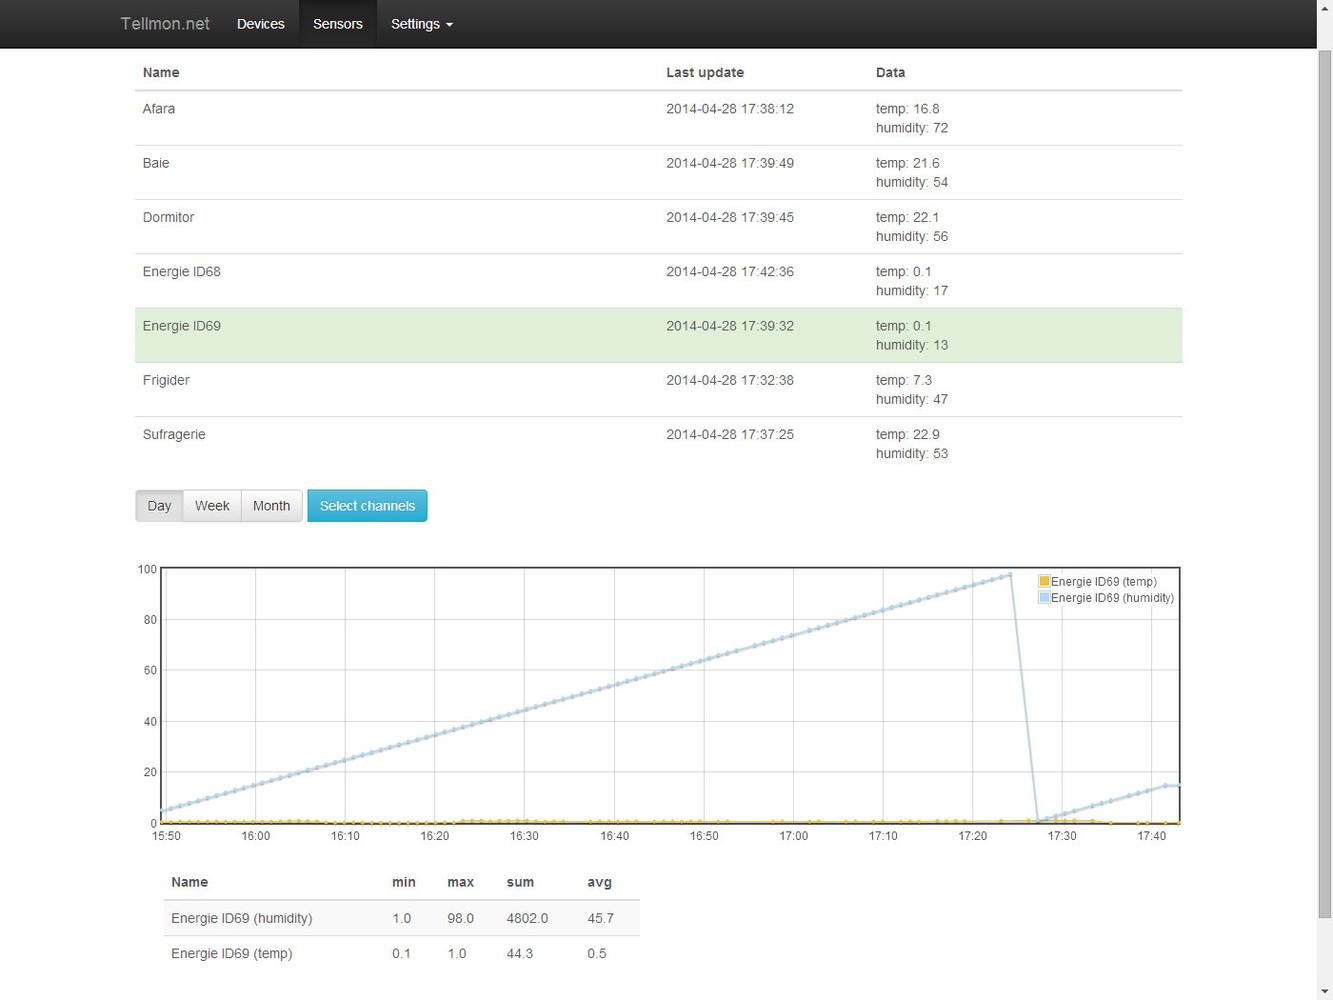
But then, I tried to set it up. And if I select as energy monitor the lower ID...
Then I get this graph, which is different from the one displayed one hour ago, where KW was shown as graph labels... now it reads select channels, yet... it displays nothing if I select the temperature of this sensor.
NOW I AM CONFUSED AND I AM STARTING ALL OVER:
I make visible both sensor, and give them the ID name.

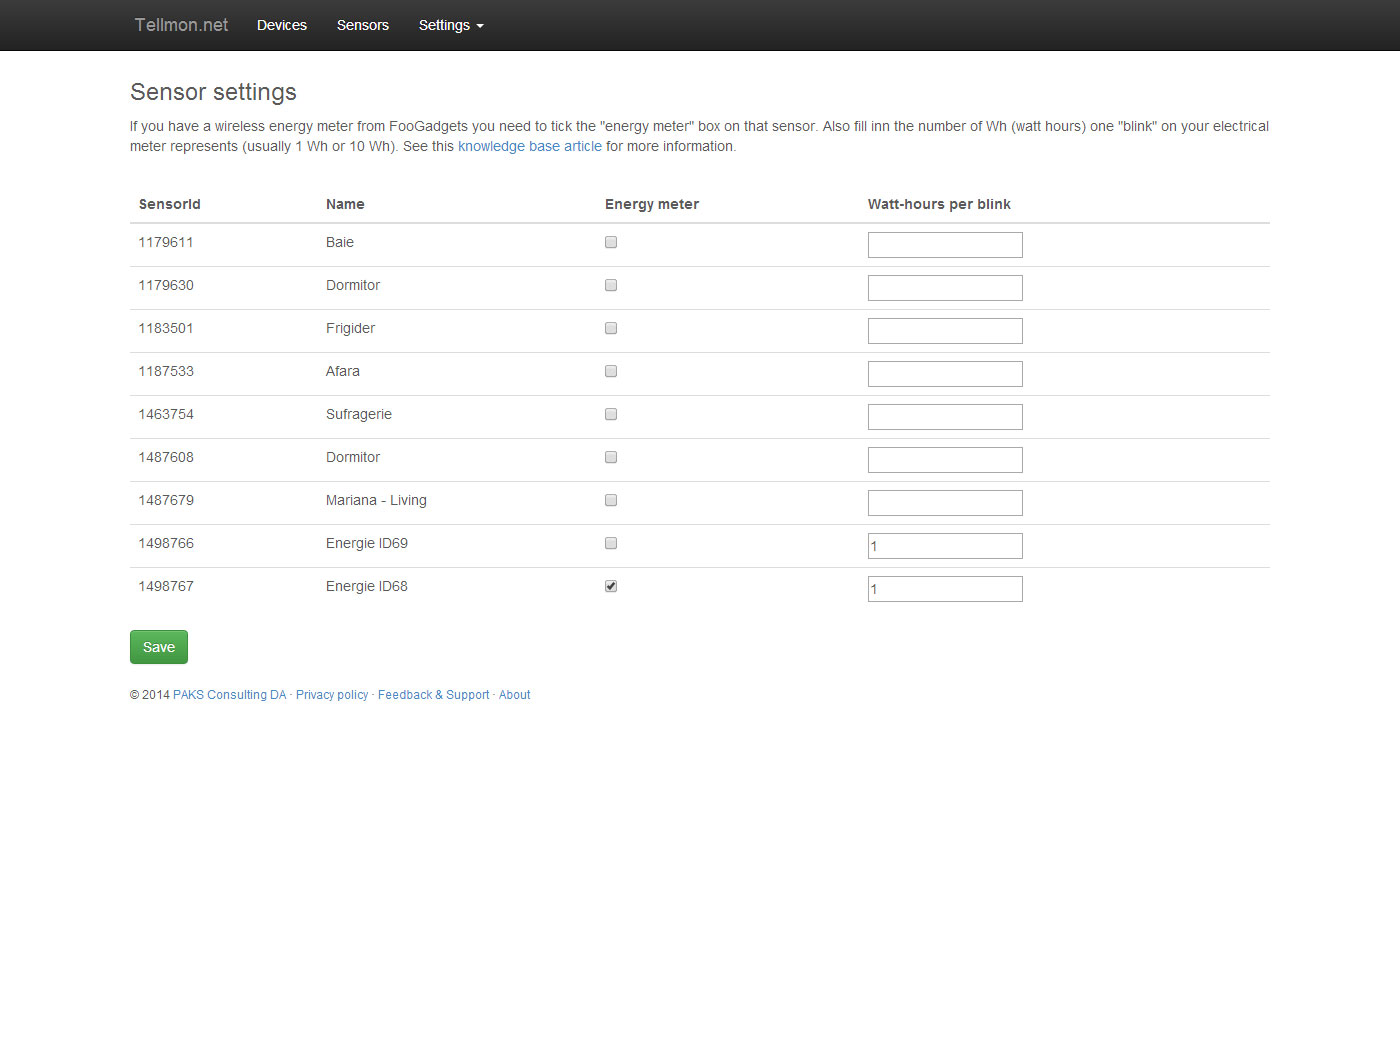
In Tellmon I select the name with ID68 as "energy monitor"...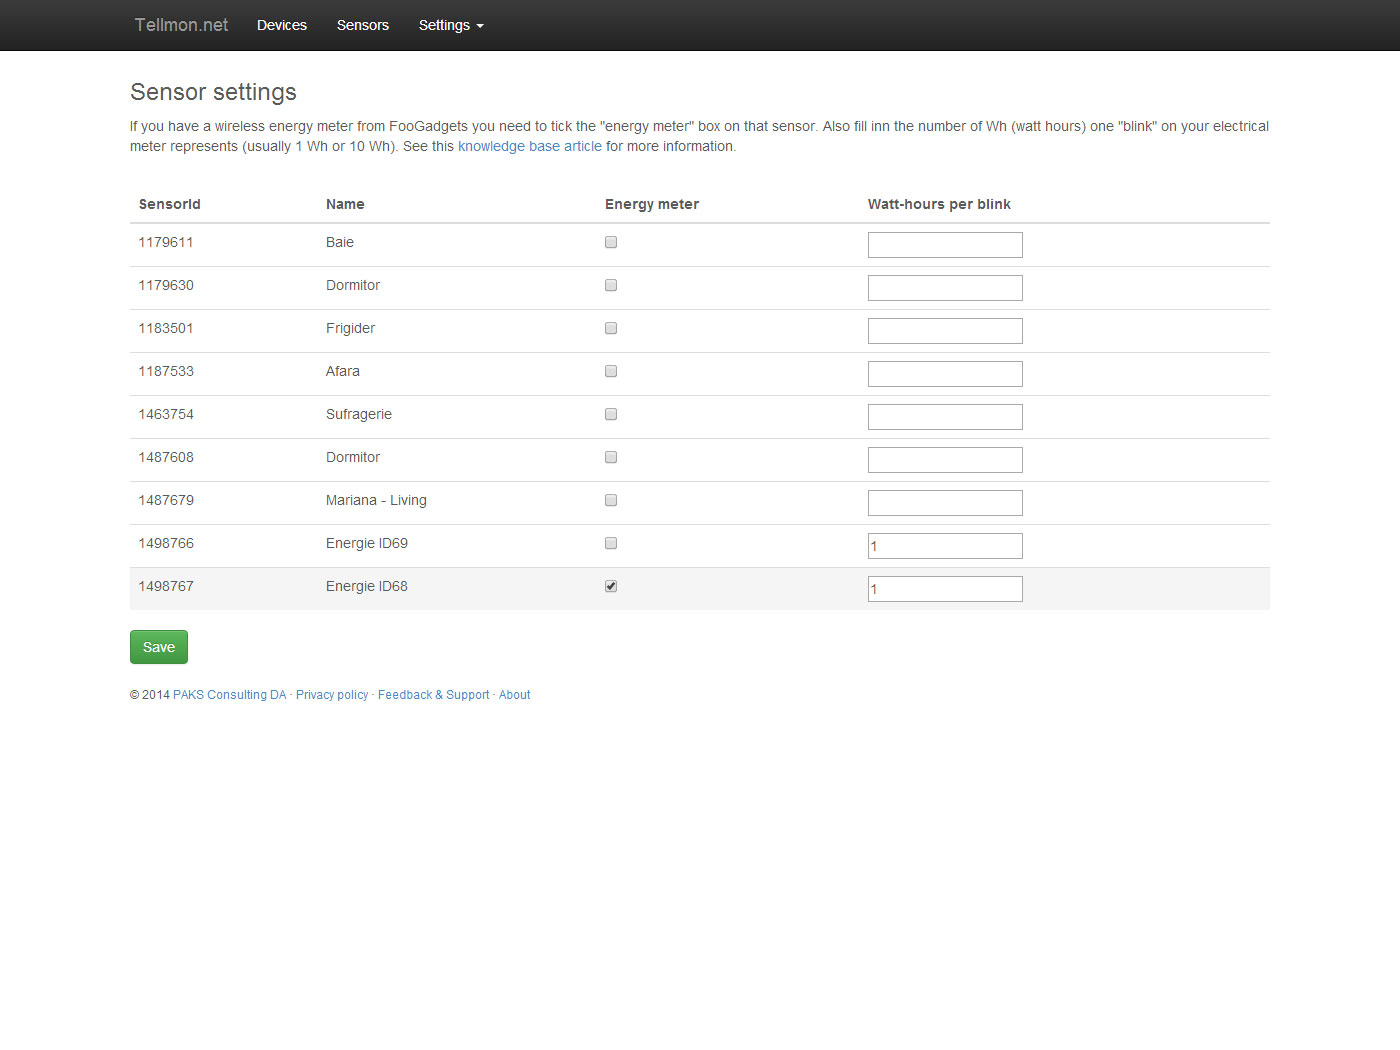
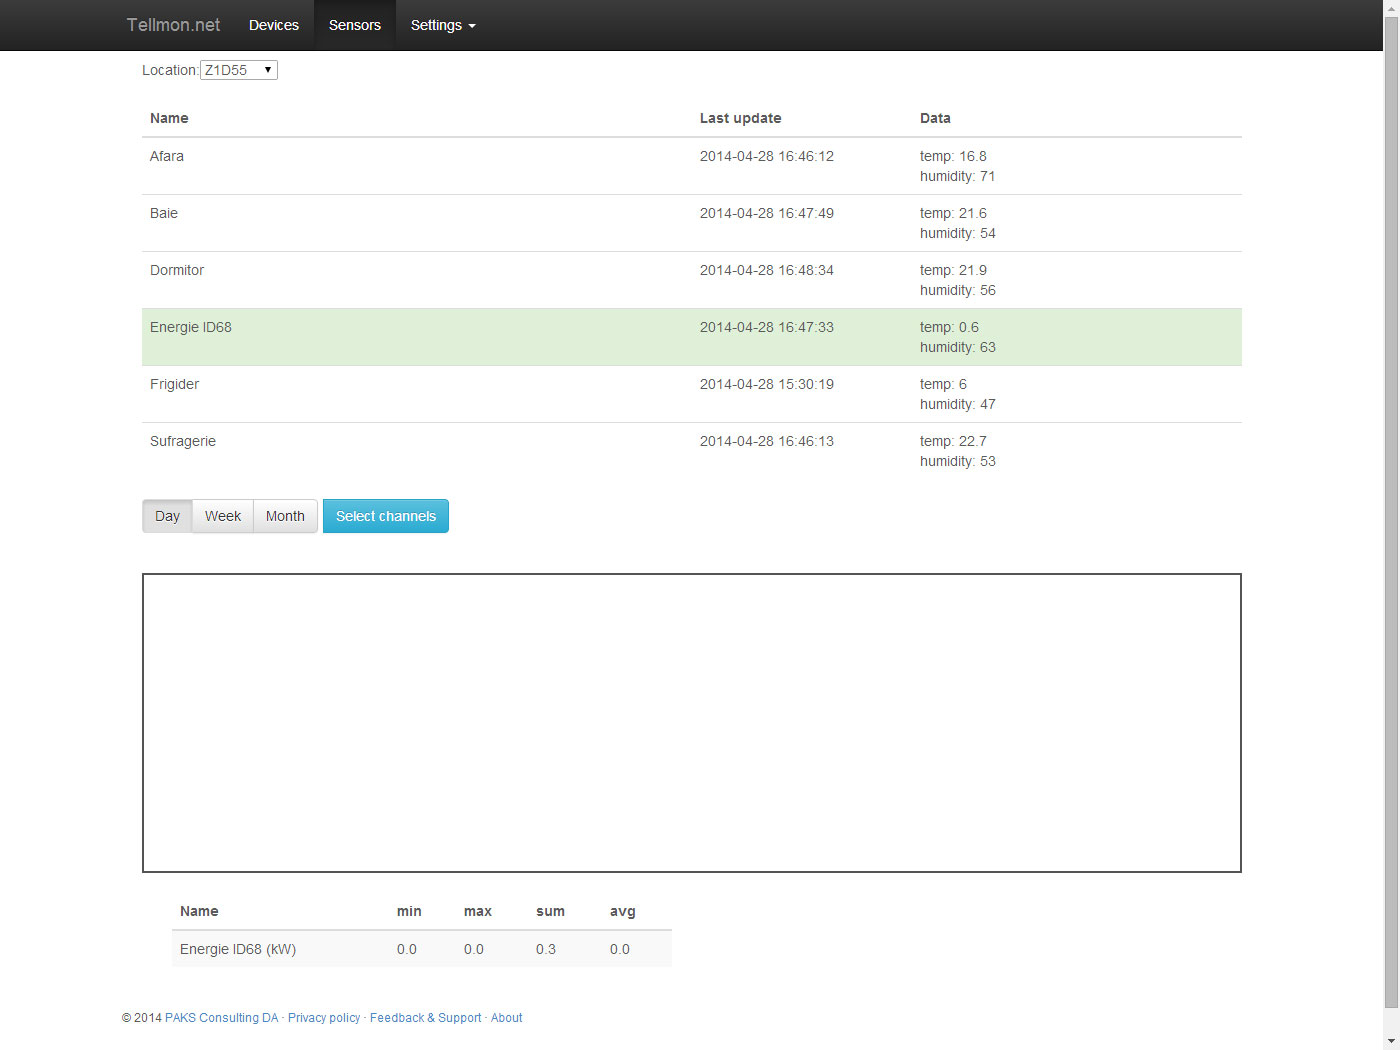
Yet, the graph shows nothing... for ID68, even though it has (kW) as measure unit...
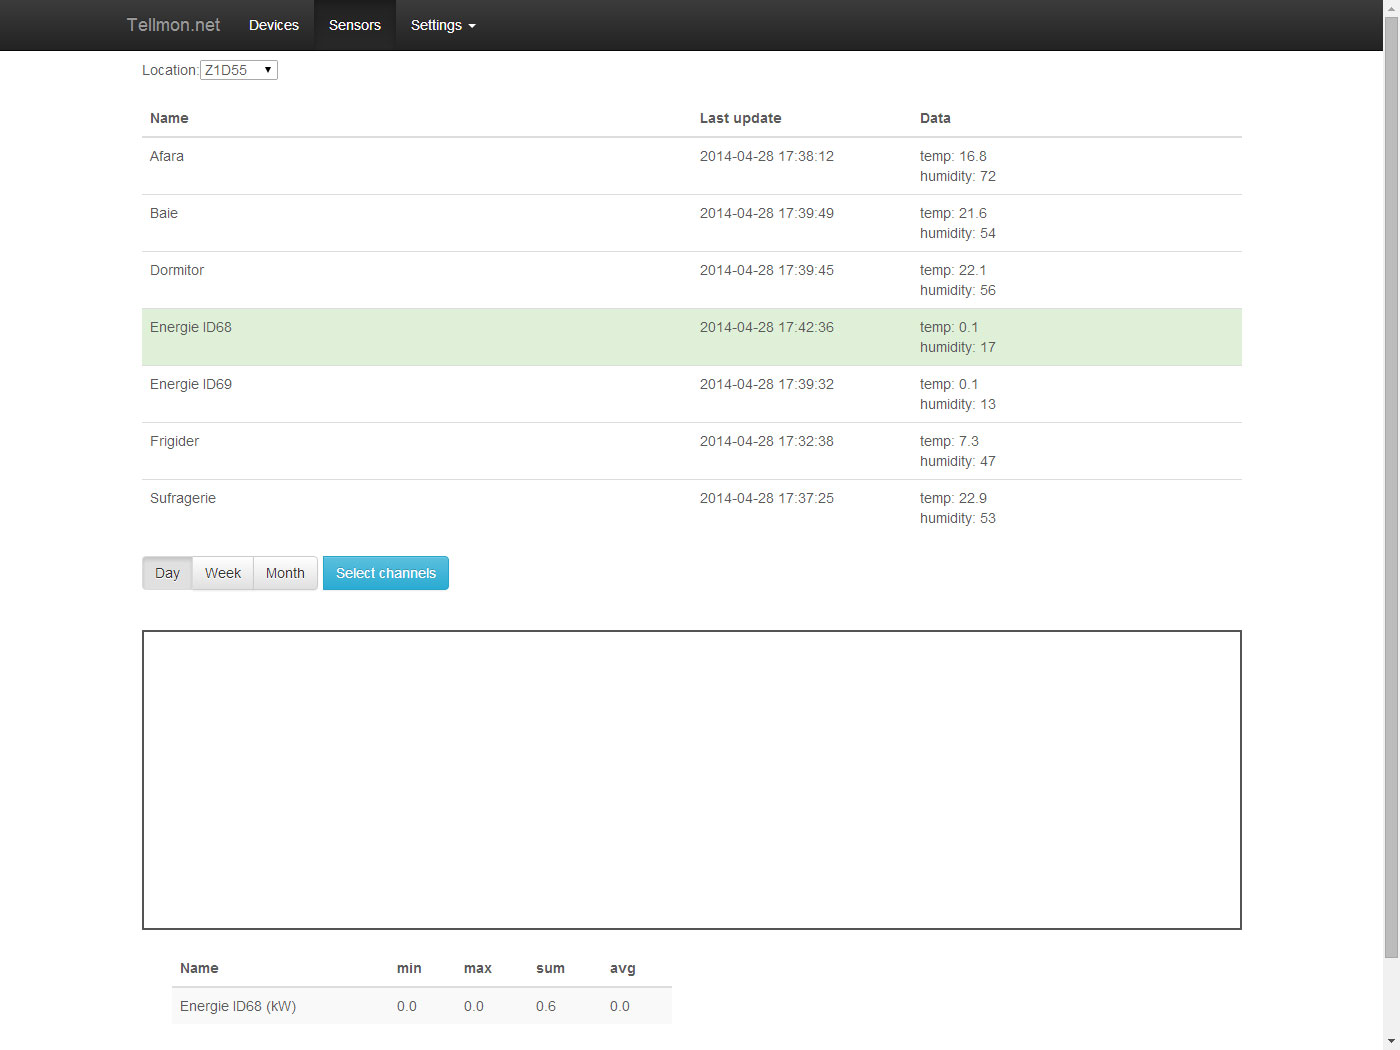
But ID69 sensors records the values as temperature & humidity...
And nothing seems to be logged at the moment...
CORRECTION: Ihis was due to the sensor missalignment over the blinking light. It took me some time to notice... I appologize.
But then, I tried to set it up. And if I select as energy monitor the lower ID...
Then I get this graph, which is different from the one displayed one hour ago, where KW was shown as graph labels... now it reads select channels, yet... it displays nothing if I select the temperature of this sensor.
NOW I AM CONFUSED AND I AM STARTING ALL OVER:
I make visible both sensor, and give them the ID name.
In Tellmon I select the name with ID68 as "energy monitor"...
Yet, the graph shows nothing... for ID68, even though it has (kW) as measure unit...
But ID69 sensors records the values as temperature & humidity...
And nothing seems to be logged at the moment...
CORRECTION: Ihis was due to the sensor missalignment over the blinking light. It took me some time to notice... I appologize.
Customer support service by UserEcho


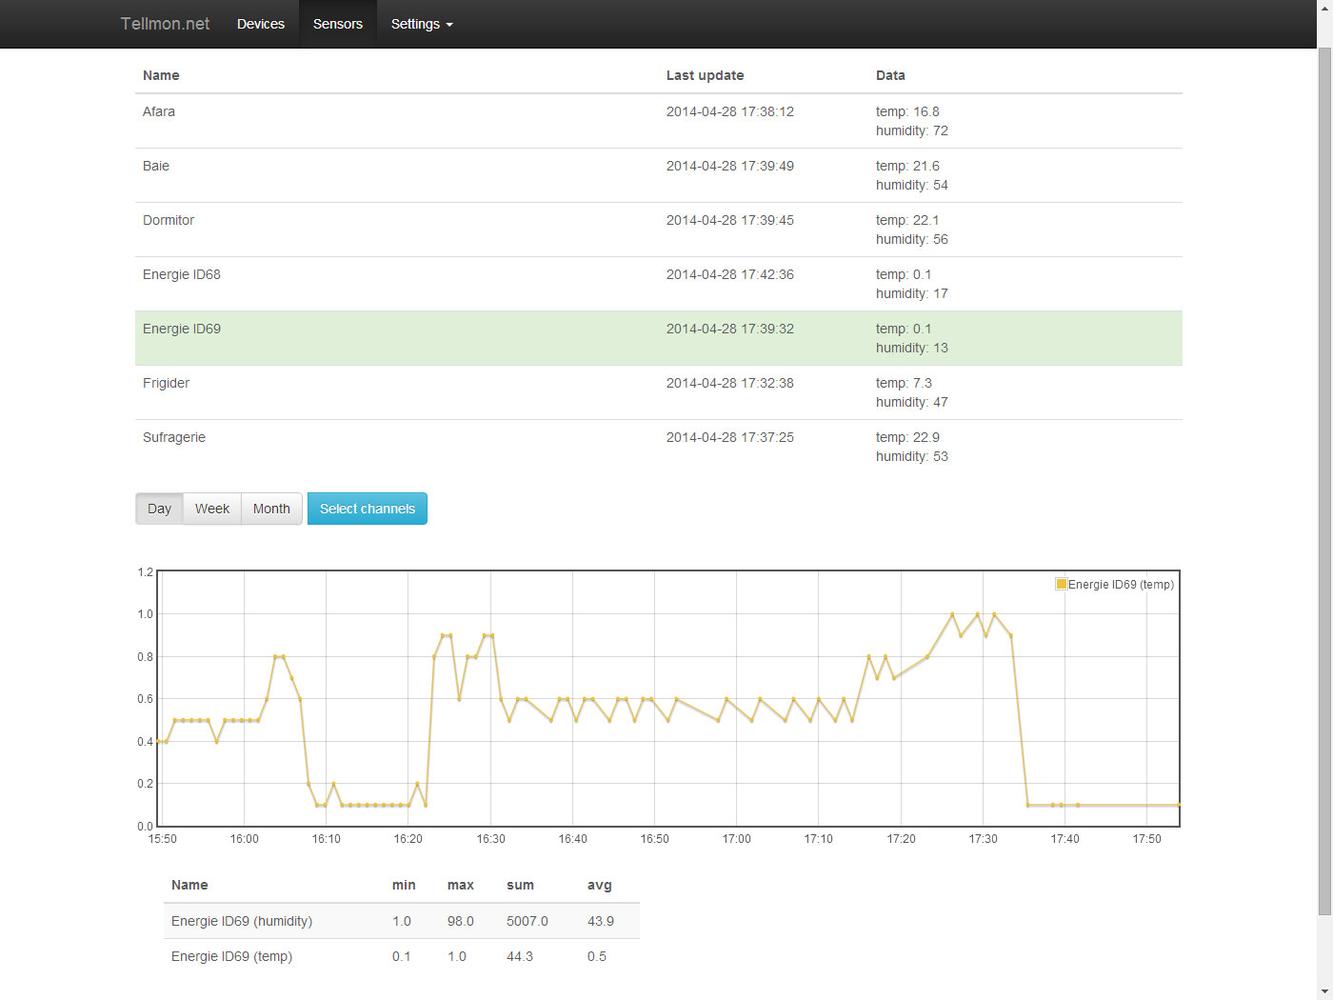
the graph seems better now.
Here is what Telldus Live shows at the moment:
kW = temp * 10 * WhPrBlink / 1000
Your sensor is reporting a temp value of 0.5. And you have entered that your power meter blinks once pr. Wh.
0.5 * 10 * 1 / 1000 = 0,005 kW which corresponds to what your graph is showing. Either your value for Watt-hours pr. blink is wrong (see https://tellmon.userecho.com/topic/412401-how-to-s... or your reader is not aligned properly to catch all the "blinks".
Either way, please contact FooGadgets where you purchased your power reader as I don't have anything to do with them.
http://foogadgets.tictail.com/product/wireless-ene...
If my sensor indicates 0.5 it means it reads 50 blinks, which means 0.5 * 10 * 1 / 1000 = 0.05 kW; not 0.005 kW!
Which should stand for a 50 Watt instant consumption measured by Energy Meter where all my other digital meters sum up almost 200 W. So there might be other things that go wrong as well.
They also say that: "One Primary sensor that carries the last minutes number of detected blinks. And a Secondary sensor that carries the penultimate number of detected blinks."
Which means a correct display by Tellmon should take into account both sensor readings. If so, one sensor would show 0.1 and the other 0.5. If corectly interpreted, the penultimate number being 1 and the ultimate number being 5 maybe the formula should be different? Maybe the total displayed should be around 0.150kW ?
Even so... the digital meters show around 0.200 kW so either way, the FooGadgets might measure differently from the digital meters that I have.
But I agree that there is something wrong somewhere :)
I don't know, I am confused.
I dare to suggest that a different setting interface should e used for the sensors declared "ENERGY METER" and also the ENERGY should be displayed in a separate Energy Meter Graph interface...
The following algorithm can be used to detect lost packages and also log to a database. See it as pseudo code,
// Callback function (If it looks similar to Telldus it is because it is based on an example from them)
void sensorEvent( int sensorId, const char *value, char *temp) {
if ( sensorId == 69 ) { //Store the secondary virtual sensor value
f_temp[sensorId] = atof( temp );
i_seqno[sensorId] = atoi( value );
return;
} else if ( sensorId == 68 ) { //Store the Primary virtual sensor value
f_temp[sensorId] = atof( temp );
i_seqno[sensorId] = atoi( value );
i_diff[sensorId] = i_seqno[sensorId] - i_prev[sensorId];
switch ( i_diff[sensorId] ) {
case 1:
case -99: // All OK
// Log f_temp in a MySql-db or send it to Xively for example.
case 2:
case -98: // One transmission lost. Check if we can recover.
if ( (i_seqno[sensorId]-i_seqno[sensorId+1]) == 1 ||
(i_seqno[sensorId]-i_seqno[sensorId+1]) == -99 ) {
// It seem like we can recover. Log the f_temp[sensorId+1] and the f_temp[sensorId] value.
} else {
// If we are here, we have lost one transmission and can not recover. Anyway, we log the current value f_temp[sensorId] and do a best guess of what the lost value was. We could use an average number or the same as current value f_temp[sensorId]. This would likely be less wrong than leaving it empty.
}
break;
default : // If we are here we have lost more than one complete transmission. If this occur frequently you have to look over your setup.
}
i_prev[sensorId] = i_seqno[sensorId];
}
return;
}
The formulas for total consumed Energy (Wh) and the current Power consumption (W), goes something like this,
TotalEnergi = Start_value + SUM(temp*10)/1000
The Start_value is optional and can be used when starting the measurements. You get it from the display on the electric meter. If you add this you will hopefully get the same numbers in the graphs as on the electric meter. The Start_value should be given in kWh. TotalEnergy is kWh.
SUM() is the sum of all incoming "temperatures". In C++ it would be written sumkWh += temp*10/1000;
Result in kWh.
Pmom = temp*10/1000*60* 60/(Time_now - Time_previous)
temp is the incoming data from the Wireless Energy Meter.
60/(Time_now - Time_previous) is a compensation factor that need to be added to compensate for the low precision oscillator in the PIC. The oscillator frequency depends on temperature and voltage. It is wise not to skip this compensation factor.
Result in kW
The primary sensor and the secondary sensor both consists of a temp/humidity pair.
The temperature is the number of blinks the last minute (/10). The humidity is a reading counter (0-99).
The secondary sensor is showing the primary sensors previous value. So using the humidity counter one can detect that a package has gone missing and then use the secondary sensors value instead.
Tellstick is not a reliable system and packages go missing all the time. That is why FooGadget has built in the secondary sensors as a backup. The primary and secondary values should follow each other. If not, there is something very wrong. Perhaps you need to update the firmware of the energy meter.
Tellmon does not support the secondary sensor yet since it's monitoring about 2100 sensors and 4900 devices the database is about 5 GB pr. month since I store all values. I'm working on resampling the data into hourly averages for data more than one month old. I'm also looking into ways to support the secondary sensor, but it needs to be in a way that is not CPU intensive because of the large volume of data coming in.
What I don't understand is why my plug meters show something so different than Energy Meter. I mean, is desirable to consume 200W and my counter have on record 5W, but I don't think this is the actual fact. I have rechecked the alignment of the sensor, and is ok.
4 blinks per passed time between 2 records / 1000 blinks per kW = 0.004 kW in the passing time
If I had a 324 blinks within one minute, the sensor would have sent 32.4 at one recorded time. and the consumption in that minute would be:
4 blinks per passed time between 2 records / 1000 blinks per kW = 0.324 kW in the passing time
All goods, but the power is displayed in kWh not kW. So the last number should be transformed to kWh. Say the interval for the above example is exactly 60 seconds; that means the numbers in kWh would be 0.24kWh and 19.44kWh, which is the nominal power.
In fact the precise formula is given by FooGadgets:
Pmom = temp*10/1000*60* 60/(Time_now - Time_previous)
That means that the way is displayed now, it is correct, but with confusion, because the power is usually expressed in kWhour not kW. That's all. I dare to suggest to implement this exact formula, to avoid missunderstandings. It is much more intuitively to read an energy meter that shows an instant consumption of say 0.240kWh instead of 0.004kW since the last reading. Otherwise, eeach user would have to figure out by multiplying 0.004 with 60 minutes.
That's not true.
http://en.wikipedia.org/wiki/Power_(physics)#Units
"The SI unit of power is the watt (W)."
http://en.wikipedia.org/wiki/Units_of_energy#Electricity
"The energy unit used for everyday electricity, particularly for utility bills, is the kilowatt-hour (kWh)."
Maybe it should take into consideration the way other energy monitors on the market display their numbers for instant consumption.
Unfortunately I have neither a FooGadget energy reader of my own, now any other energy monitors that display instant consumption. I've been trying to simulate the FooGadget device in order to develop support for it. I have some ideas about how to support time variation and missing data packages. But since I'm running in Azure on a scaling infrastructure (max 2 servers) I need a way that is both computationally cheap and that can scale out over multiple servers.
As of now tellmon.net costs me about NOK 700 a month in Azure hosting and I really need to either move to another cheaper host, or add enough features so I can start offering a subscription for the more advanced stuff. The main cost is actually the SQL server for storing all the data. It's growing with about 5 GB a month. I've been looking into other storage means like https://tempo-db.com/ but that again costs from USD 100 a month and up, but would fit tellmon's use great.
Here you can see the units used to display the numbers. I do not have that actual monitor.
All the monitors on the market display in these unit of measure. So it is just about that, display instant consumption in kWh. You display in kWmin.
And I really can't understand how adjusting the formula to take into account time interval would complicate things in hosting. The result of the formula would be just another number to store. and the calculus I doubt it would be so processor intensive, but yes, I do not know that for a fact, you may know better.